Excel files often hold the most concrete content in a business workflow: pricing tables, sales reports, product catalogs, customer lists, and financial models. The data is already organized, but it stays trapped inside the workbook. This tutorial shows how to turn an Excel workbook (XLSX or CSV) into an editable HTML data landing page with HtmlDrag AI Creator, then keep editing the page — including the table cells — without writing code.
At a glance:
- Upload an XLSX or CSV workbook to AI Creator File Mode (the demo uses Microsoft''s public Financial Sample workbook) and generate an editable HTML data landing page.
- AI Creator reads the table, recognizes its purpose (data display, comparison, pricing, item list, or explainer) and keeps only the fields that matter for that page type.
- Open the result in the HtmlDrag visual editor to refine hero copy, replace visuals, and adjust layout — no HTML or CSS required.
- Toggle "Page interaction" in the right panel to flip pagination and tabs inside the editor, so you can review and update numbers on every page of the generated table.
- Toggle "Quick Edit" to get a floating toolbar — double-click a table, place the cursor on the target cell, then click the toolbar''s Edit button to update the value.
The harder problem is the next step: how do you turn an Excel workbook into a real web page that customers, prospects, or stakeholders can actually read? Most teams either screenshot the table, embed a static iframe, or ask a developer to rebuild the page from scratch.
This article shows a different workflow. Using AI Creator File Mode in HtmlDrag, you can upload an Excel workbook (XLSX or CSV) and generate an editable HTML data landing page that already has structure, hierarchy, and a visual layout. Then you can keep refining it in the same canvas.
Why Excel to HTML Is More Than a Simple Table Converter
Most "Excel to HTML" tools focus on one thing: turning a worksheet into a static HTML <table>. That is fine if you only need the raw table. But it is not enough if you need a real page.
- turn an XLSX workbook into a structured landing page
- convert spreadsheet data into a web-friendly report
- generate a comparison or pricing page from Excel
- build a no-code dashboard page from a CSV
That makes "spreadsheet to landing page" a strong long-tail topic for marketers, finance leads, founders, product managers, and operations teams that already have the data but need a page they can actually share.
The Example: A Microsoft Financial Sample Workbook
The example used in this article is the public Financial Sample workbook published by Microsoft for Power BI tutorials. It is a small XLSX file with about 700 rows of business data covering segment, country, product, units sold, manufacturing price, sale price, gross sales, discounts, sales, COGS, profit, and date breakdown by month and year.
This kind of workbook is a great fit because it has a clear schema, a clear unit of analysis, and enough variety in fields to test how AI Creator turns a flat table into a layered HTML page rather than a basic <table> dump.
 Step-by-Step: Generate an HTML Data Landing Page From an Excel Workbook
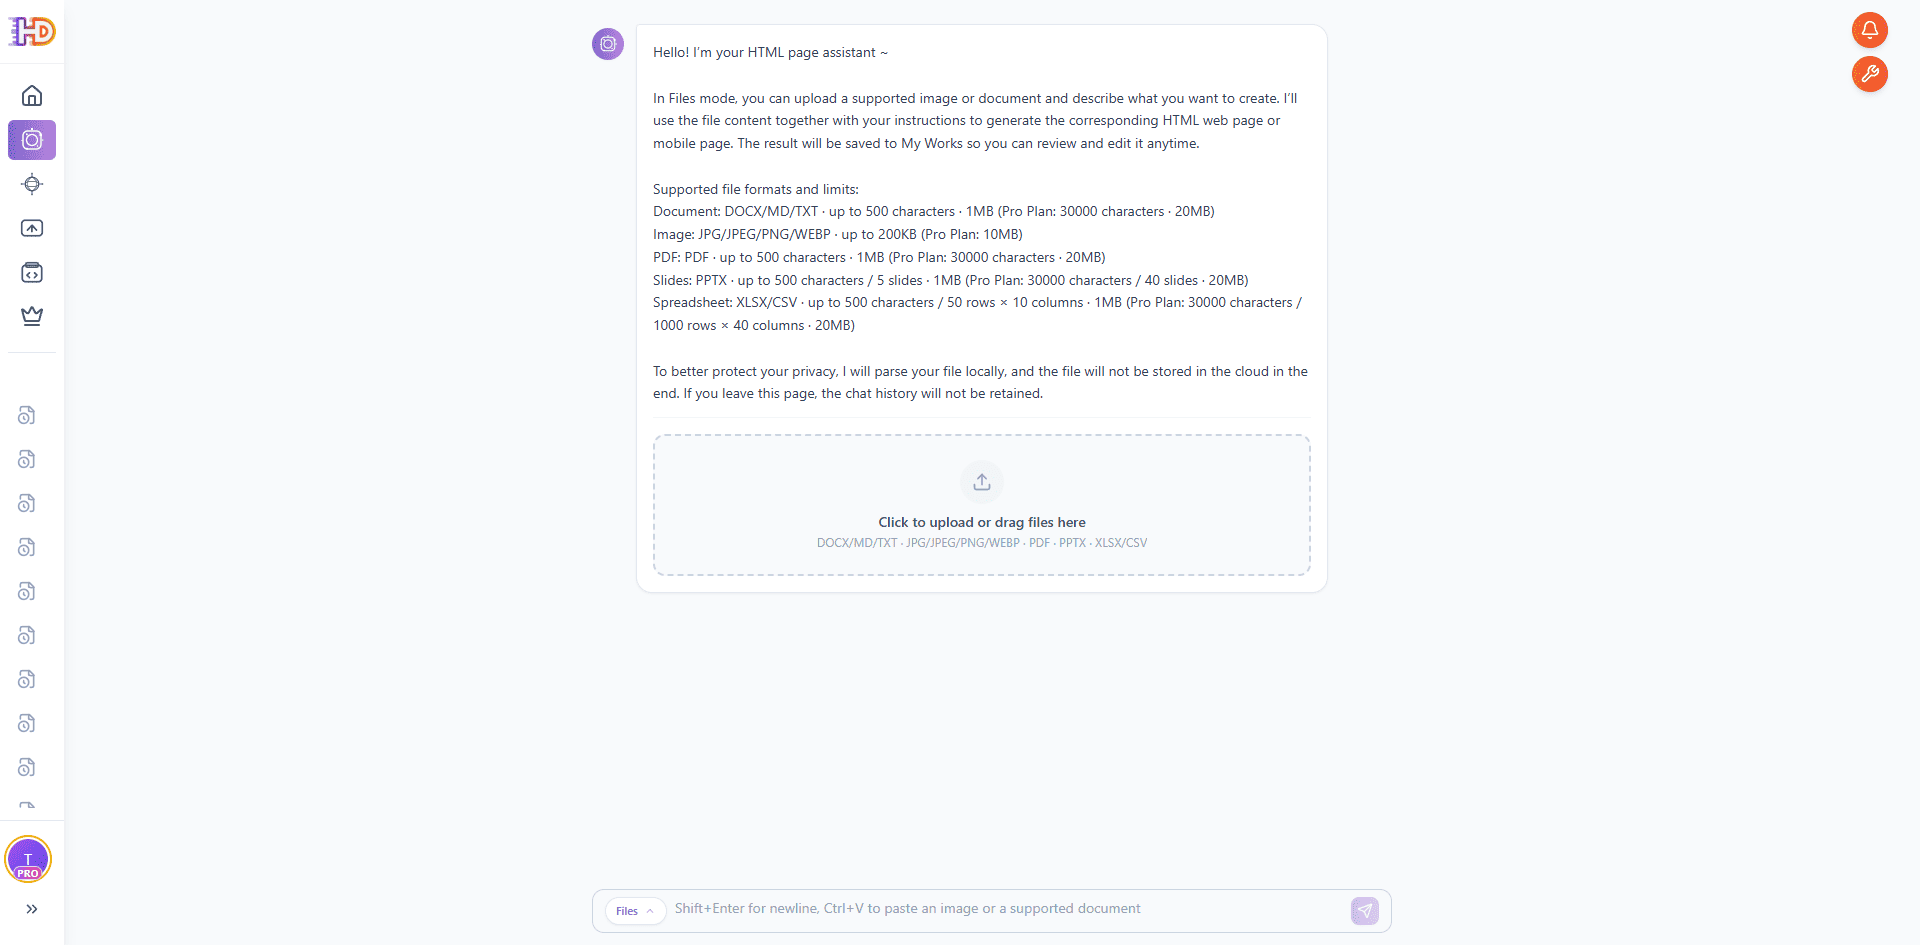
Step 1: Upload the XLSX to AI Creator File Mode
Open AI Creator on htmldrag.com and switch to file mode. If you want the complete overview of AI Creator before uploading a workbook, including supported formats, file-handling notes, and where each file-to-HTML workflow fits, read the HtmlDrag AI Creator guide. The supported formats include PDF, PPT/PPTX, Excel/XLSX, CSV, Word, Markdown, TXT, and JPG/PNG; for this workflow the relevant ones are XLSX and CSV. Legacy .xls is not part of this workflow — convert to .xlsx first, or export to .csv if the workbook is mostly a flat table.
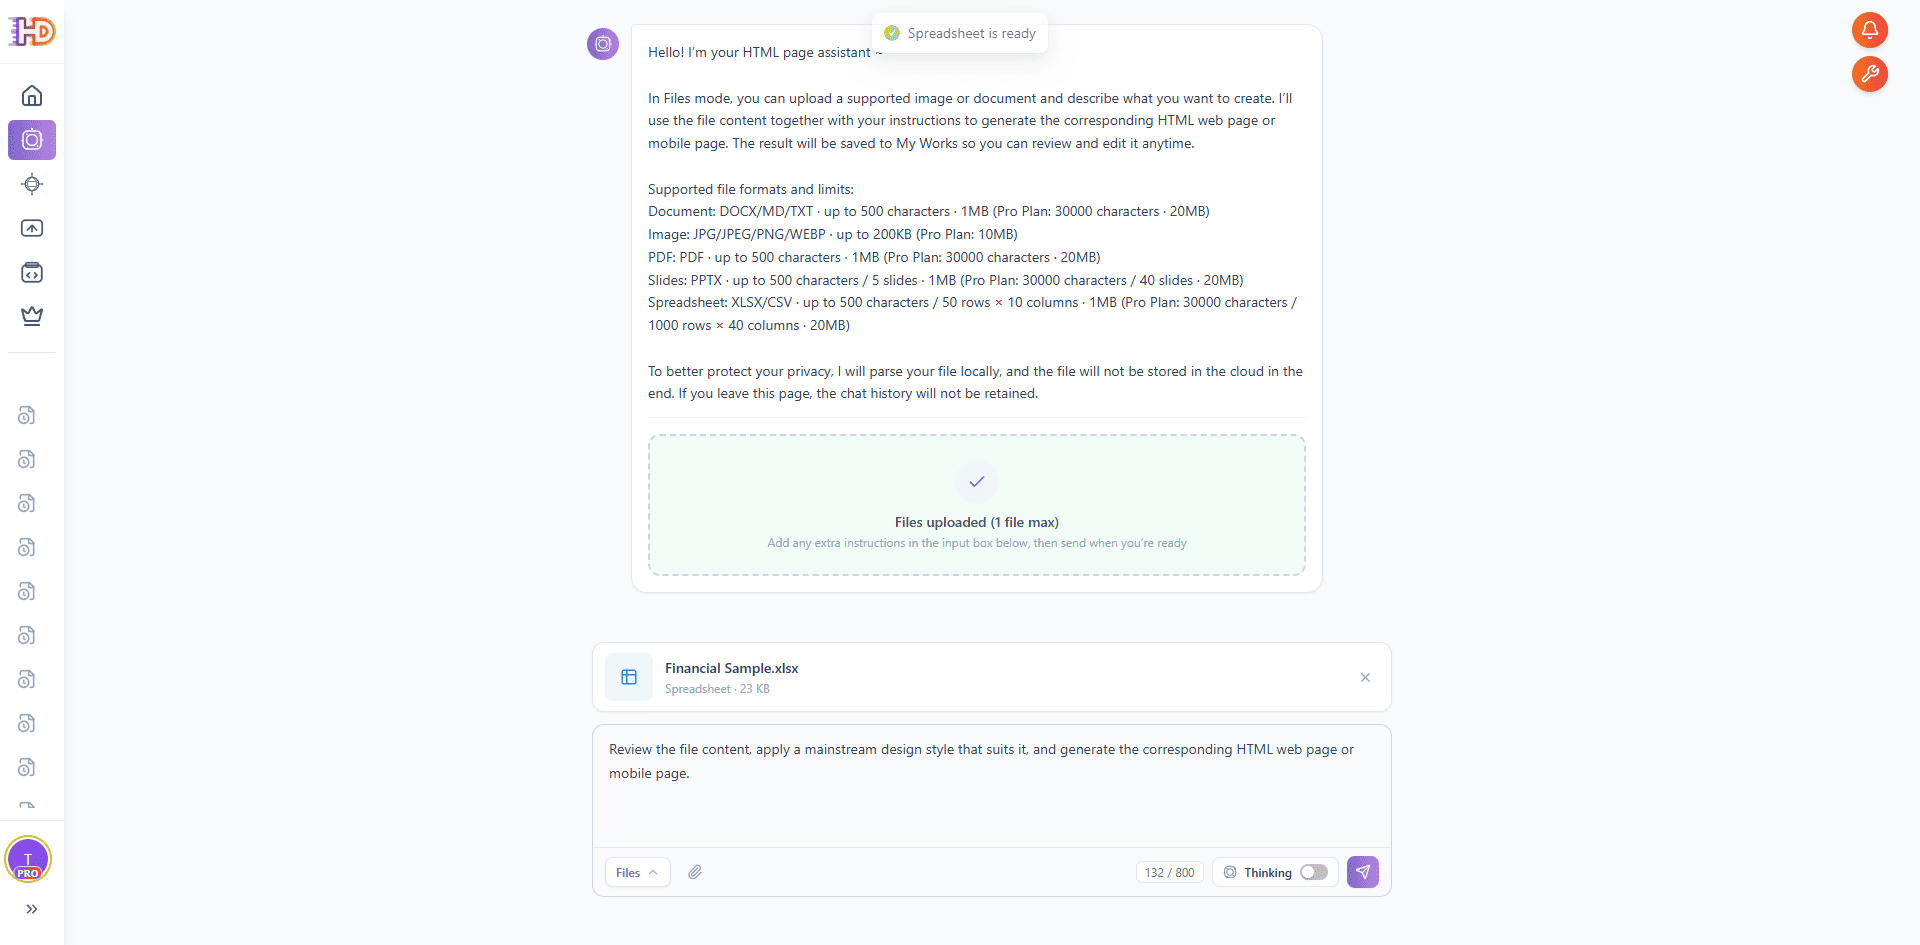
 Drop the Financial Sample workbook into the upload area. AI Creator parses the file locally in the browser first — reading the rows and columns before sending a structured snapshot to the model — and the original file is not kept in long-term cloud storage afterwards. When parsing finishes, a "Spreadsheet is ready" indicator appears, and a file card with the workbook name and size, for example Financial Sample.xlsx · Spreadsheet · 23 KB.
You do not need a long prompt. A short instruction is enough — for example "Review the file content, apply a mainstream design style that suits it, and generate the corresponding HTML web page or mobile page", or just "Turn this workbook into a financial overview landing page". The short goal works because the workbook already carries the schema, the values, and the implicit business meaning.
 Step 2: Let AI Creator Read the Workbook and Build the HTML Page
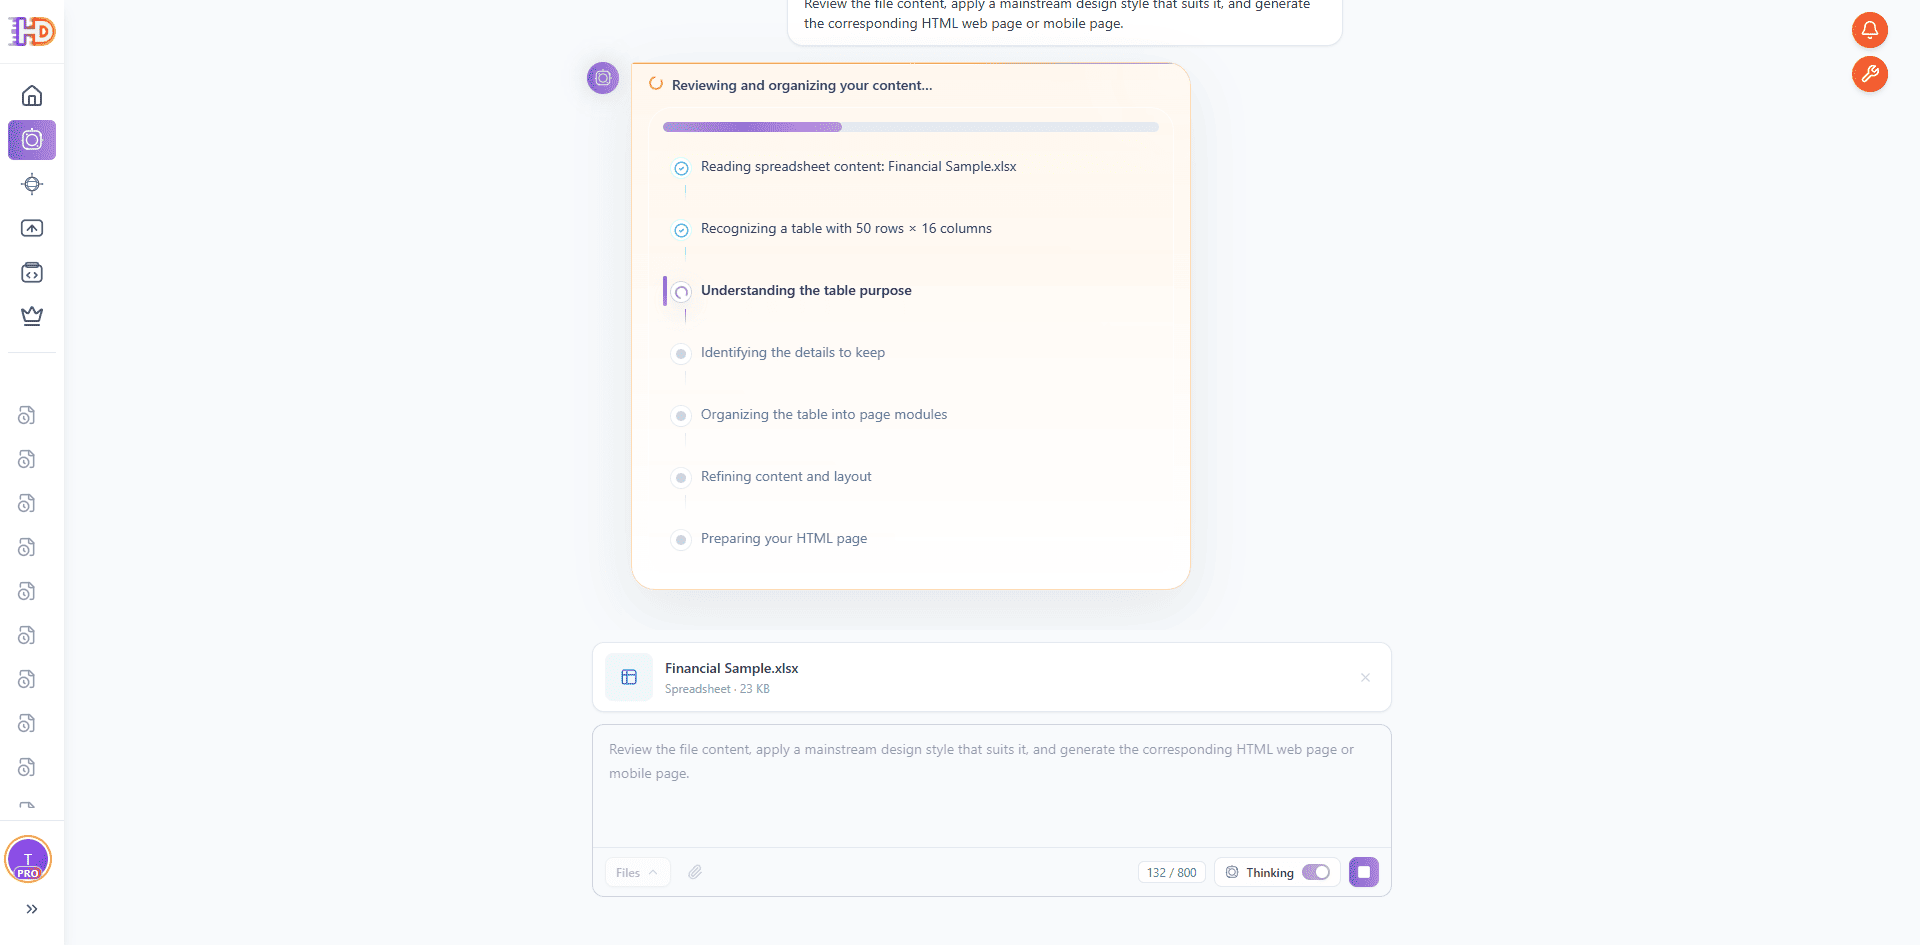
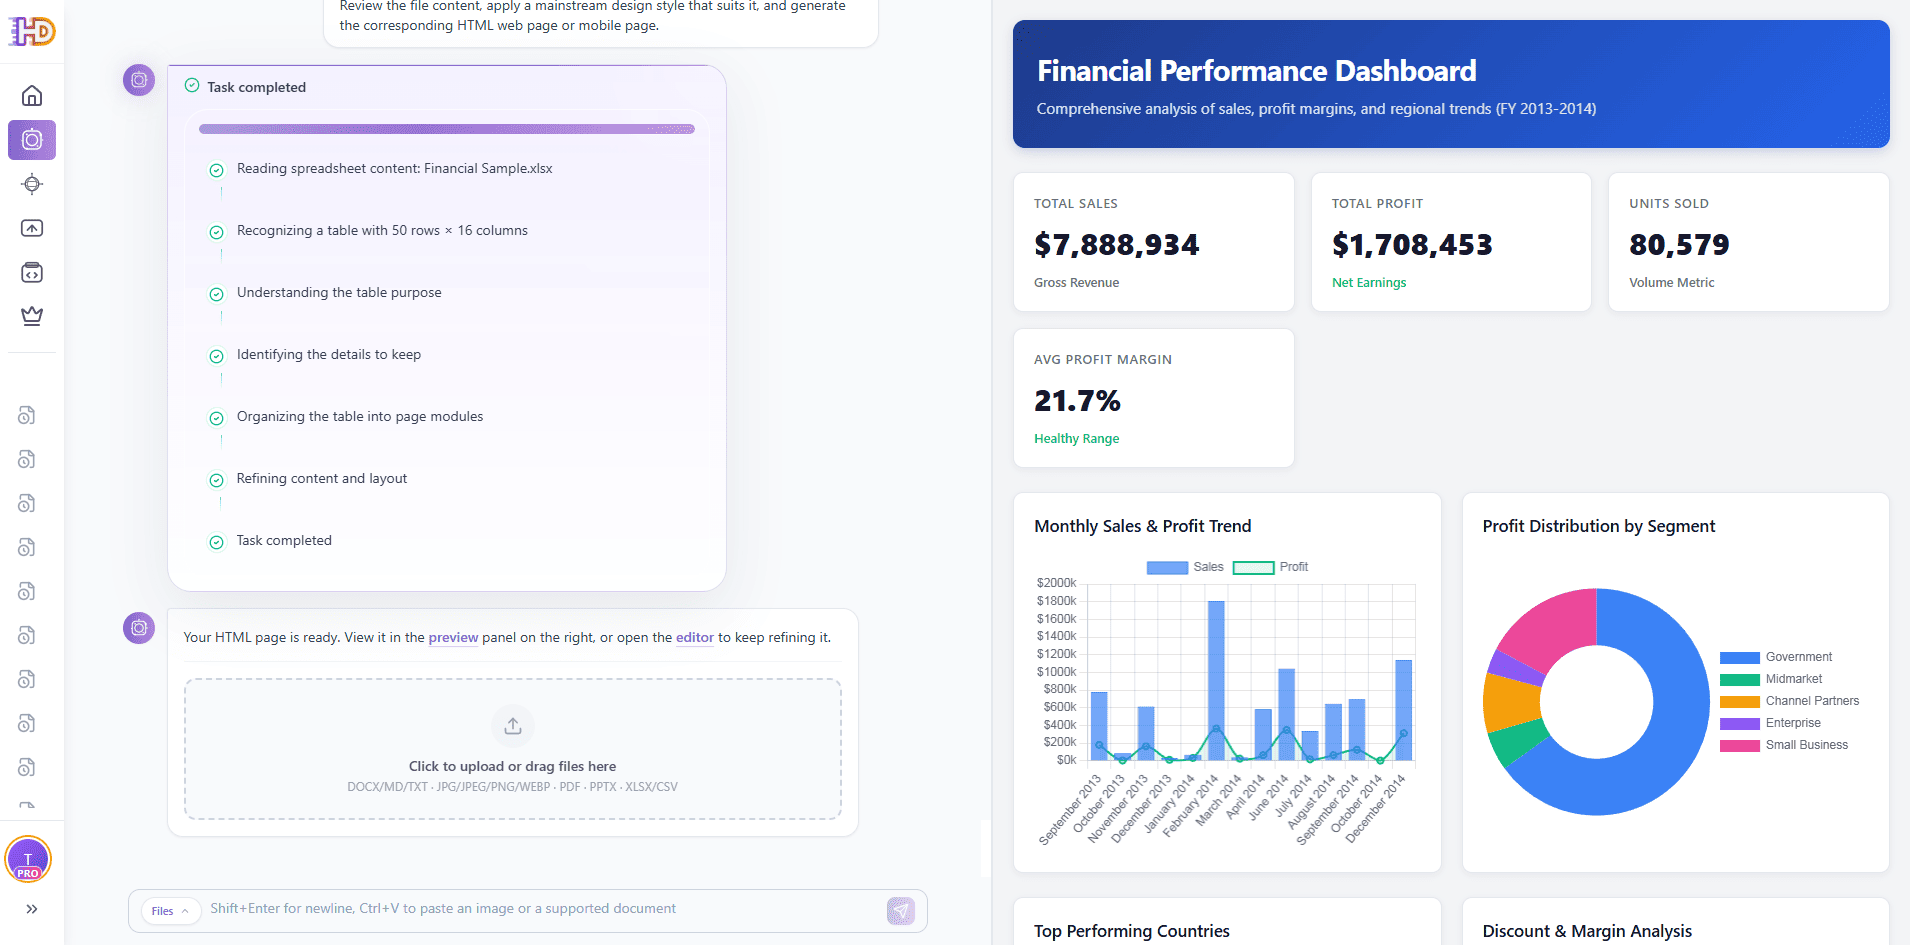
After sending the request, AI Creator begins to organize the workbook. The reasoning panel walks through several important steps: reading the spreadsheet content, recognizing the table size (for the demo workbook, 50 rows × 16 columns), understanding the table purpose, identifying the details to keep, organizing the table into page modules, refining content and layout, and preparing the HTML page.
This is the part that separates a real "spreadsheet to web page" workflow from a basic table converter. AI Creator does not just dump rows into HTML — it decides whether the workbook is best presented as a data display page, a comparison page, a pricing section, an item list, or an explainer, and keeps only the fields that actually matter for that page type.
 Once the table purpose is clear, AI Creator moves into HTML construction. The progress view shows the page being built section by section, with a percentage indicator and an estimated time remaining, while the reasoning panel keeps tracking the transformation from raw spreadsheet data into structured page modules.
For a marketing, product, finance, or operations team, this is the high-value moment: a static XLSX file begins turning into a browser-based HTML page that can be reviewed, shared, edited, and exported — without manually rebuilding it from scratch.
 Step 3: Review the Generated HTML Data Landing Page
When generation is complete, a task-completed indicator appears and the preview slides in on the right side. For the Financial Sample workbook, the result is no longer a flat spreadsheet — it is a structured Financial Performance Dashboard with a hero header, top-level KPIs (total sales, total profit, units sold, average profit margin), a monthly sales and profit trend chart, a profit distribution donut by segment, top-performing countries, and a discount and margin analysis block.
 Switch to full-screen preview to check whether the generated page reads as a standalone web experience. With the Financial Sample workbook, stakeholders see a real overview page — hero header, four KPI cards, monthly trend chart, profit distribution chart, top-performing countries table, and discount and margin analysis section — useful for internal review before investing in a full design and development cycle. The toolbar exposes Editor, Share, Image, and HTML actions so you can move into editing, sharing, or exporting at any point.
 Step 4: Open the Generated Page in the HtmlDrag Visual Editor
The final stretch is where HtmlDrag becomes more practical than a one-shot AI code generator or a simple online file converter. After AI Creator generates the page, open it in the visual editor — the same canvas where every existing HtmlDrag project lives.
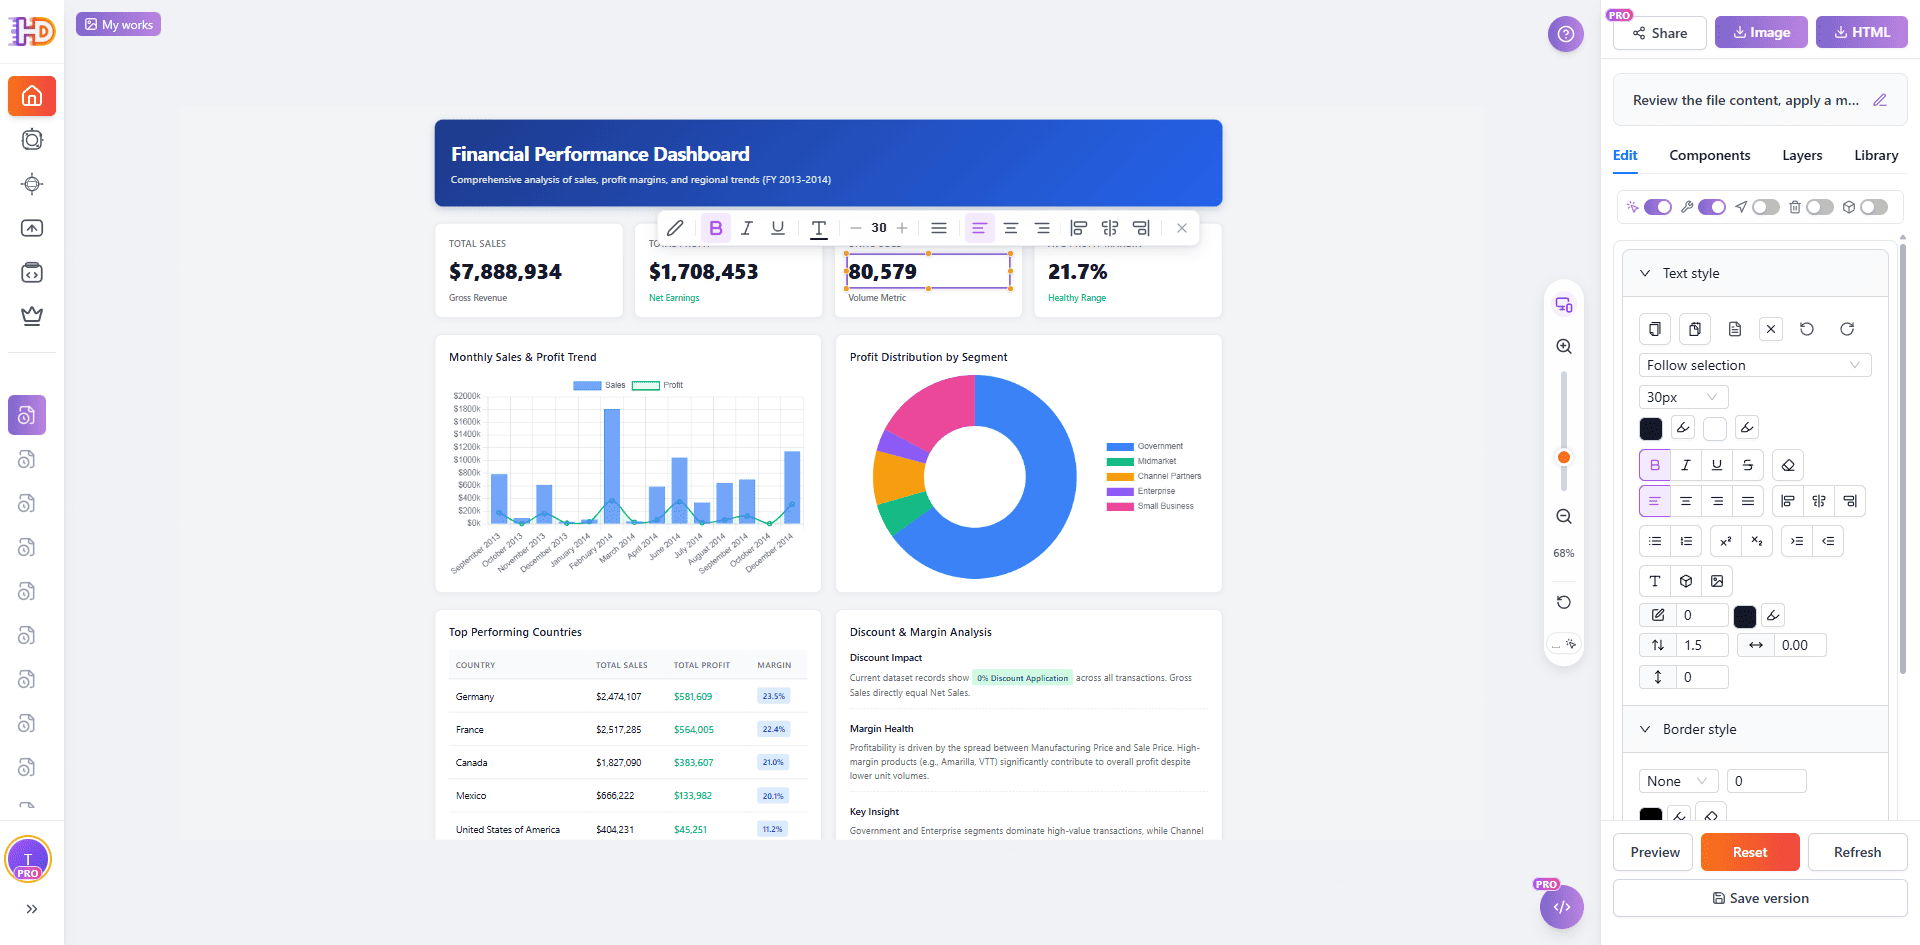
Click any KPI card, chart label, or section title to bring up the floating Quick Edit toolbar. From there you can adjust text style, font size, alignment, color, and spacing in place — no need to drill into CSS or restart generation. The right-side panel exposes the standard HtmlDrag editing tabs (Edit / Components / Layers / Library), plus the toggles for delete mode, decorative layers, page interaction, and quick edit.
 Step 5: Edit Table Cells Directly, Then Save or Export
Tables generated from the workbook are not flat images. Every cell stays editable. To update a number — for example a top-country total sales figure — turn on "Quick Edit" in the right panel, double-click into the table, place the cursor on the target cell, then click the Edit icon in the floating toolbar to drop straight into cell editing. Type the new value and click outside the cell to confirm. (For the full flow and the matching pagination story, see Stay Hands-On: Page Interaction and Quick Edit below.)
 This closes the full workflow: Excel workbook → AI-generated HTML page → visual drag-and-drop refinement → in-cell number updates → save and export. From here you can Save version to keep a snapshot, export clean HTML for hosting on Vercel, Netlify, or your own server, share a public preview link with stakeholders, or download the page as an image — all without leaving the browser. Because HtmlDrag treats the generated dashboard as a regular project, you can keep coming back, swap in new monthly numbers, and re-export, instead of regenerating the page from scratch every time the workbook changes.
Traditional Excel Export vs AI Creator File Mode
| Task | Traditional Excel export or table converter | HtmlDrag AI Creator |
| Start from an XLSX workbook | Often exports a static table or requires manual rebuilding in a website builder | Reads the workbook and uses the data as structured source material |
| Create a real web page | The result usually looks like a raw table inside an empty page | Generates a landing-page-style layout with hero, metrics, segments, and CTA |
| Make small visual changes | Usually requires editing code, re-exporting, or restarting the conversion | Supports visual editing, drag-and-drop refinement, and image replacement |
| Prepare for review or delivery | The output is hard to share without technical help | The generated page can be previewed, shared, saved, and exported as HTML |
Best Excel Workbooks for This Workflow
This workflow works best when the workbook already has a clear unit of analysis and consistent columns. You do not need a perfect dataset, but the structure should make the table purpose readable to AI Creator.
- Sales or financial reports with segment, country, product, and revenue columns — generate a data overview landing page
- Pricing tables with plan name, price, billing period, and feature columns — generate a comparison or pricing page
- Product catalogs with item name, category, price, and description — generate an item list or showcase page
- Customer or partner lists with company, region, and segment — generate a credibility or social proof section
- Dashboards or KPIs with date breakdown and metric values — generate a clean summary page with hero numbers
Stay Hands-On: Page Interaction and Quick Edit for Excel-Generated Pages
Excel data is rarely "set and forget" content. Numbers change every week — a price moves, a discount band gets retuned, last month''s sales come in. That is why HtmlDrag''s editor includes two specific switches that make a generated Excel page genuinely editable, not just a static snapshot.
Flip Through Pagination With "Page Interaction"
If your Excel data is large enough, AI Creator may split it into a paginated table, a tab group, or an expand-and-collapse block. Those interactive parts are blocked by default to protect the editing canvas. To switch them on, open the right panel and toggle "Page interaction".
Once Page interaction is on, you can:
- click the pagination buttons (Previous / Next, page 1 / 2 / 3 …) to flip through every page of the generated data
- switch tabs across product segments, regions, or report periods
- expand or collapse content sections without leaving the editor
- follow safe links inside the page exactly the way a real visitor would
This matters for Excel workflows because the numbers are often what you actually want to edit. Page interaction lets you walk through every page of the table inside the editor, review each value, and then go back and update the ones that need to change before exporting.
Edit Any Cell With "Quick Edit"
Tables generated from a workbook are not flat images. Every cell is editable. There are two ways to enter a cell.
The native click rhythm. Tables in HtmlDrag follow a click pattern: a single click selects the table, a double-click drills into a row, and a third click drops the cursor inside a specific cell so you can change the value. This works without any extra setting, but it requires precise targeting.
The faster way (recommended): Quick Edit. Turn on "Quick Edit" in the right panel. With Quick Edit on, a floating toolbar follows the selected element, and the flow becomes much shorter:
- Toggle Quick Edit on in the right panel.
- Double-click the table you want to update.
- Move the cursor onto the target cell so it becomes the active element.
- Click the Edit icon in the floating Quick Edit toolbar to drop straight into cell editing.
- Type the new value and click outside the cell to confirm.
This second flow keeps your hands close to the data: you only have to think about which cell to fix, and the floating toolbar does the rest. For Excel-generated pages with dozens of pricing rows, KPI cards, or quarterly numbers, this is by far the fastest way to keep the page in sync with the latest workbook values.
FAQ
Can AI Creator generate an HTML page from an Excel workbook?
Yes. In this workflow, AI Creator File Mode accepts XLSX and CSV files and generates an HTML page based on the table structure, columns, and values, then opens the result in the HtmlDrag visual editor.
Should I upload XLSX, XLS, or CSV?
Use XLSX for modern Excel workbooks, or CSV if your data is a flat single-sheet table. Legacy .xls files are not part of this workflow — convert them to .xlsx first.
Is this the same as converting Excel to an HTML table?
No. A basic Excel-to-HTML converter outputs a static <table>. AI Creator instead reads the workbook, recognizes the table purpose, and generates a structured landing page with hero, sections, and CTA — not just a single table block.
Can I edit the generated page after AI creates it?
Yes. After generation, you can open the page in HtmlDrag and visually adjust text, metrics, layout, spacing, colors, images, and CTA blocks without writing code.
What if the first result is not perfect?
That is expected. Treat the AI-generated page as a strong first draft. The advantage of this workflow is that you can keep polishing it visually instead of asking a coding tool to regenerate small changes.
Final Thoughts
An Excel workbook should not be locked inside a spreadsheet when the team needs a real web page. If your sheet already contains the structure, the values, and the business meaning, it can become the starting point for an editable HTML landing page.
With HtmlDrag AI Creator, the workflow is simple: upload the XLSX or CSV, let AI Creator read the workbook and recognize the table purpose, generate the HTML page, preview the result, then open it in the visual editor for final drag-and-drop refinement.
If you need a faster way to turn an Excel workbook into an editable HTML data landing page without coding, AI Creator File Mode gives you both the first draft and the visual control needed to finish the page.